Learn to generate and analyse HTML intuitive reports in JMeter
HTML reports are very intuitive. Most of the time development team and upper management need this report to evaluate performance of a particular site or application.
Basic steps of creating a JMeter file(.jmx) are as follows:
Step 1: Thread group creation.
Step 2: Sending request (HTTP Request).
Step 3: Viewing the results using Listeners (Results in Tree or Table).
Step 4: Run jmx file into Non GUI mode and generating the HTML reports.
There are two ways to generate html reports:
Approach 1: to create report at the end of the test
————————————— — — — — — — — —
jmeter -n -t(path of .jmx file) -l(path of examples folder along with name of csv file where you want to keep the results) -e -o(path of output folder where you want to save the results)
Approach 2: create report from a standalone csv file
———————————————— — — — — — —
jmeter -g (path of resultant csv file) -o (path of output folder where you want to save the results)
Non GUI commands with explanation:
# Jmeter -n : This command tells the command prompt I want to run my Jmeter script in Non GUI mode.
#Jmeter -t : This will pick the Jmeter .jmx file and execute it. Here we give the path of jmx file which is under bin folder by default or could be in other folder.
# Jmeter -l : Here we give the path where we want to save the executed results into .csv format. We give the path of bin/example folder along with the same name of csv file. Better to create a folder named “csv” in bin/example folder to keep separate your csv and html files.
# Jmeter -e : This command is used to convert the .csv results into HTML format at the end of the test.
# Jmeter -g : [path to CSV file] generate report dashboard only.
# Jmeter -o : This command saves the html results into given output folder. Better to create a folder named “html” in bin/example folder to keep separate your csv and html files.
Approach 1:
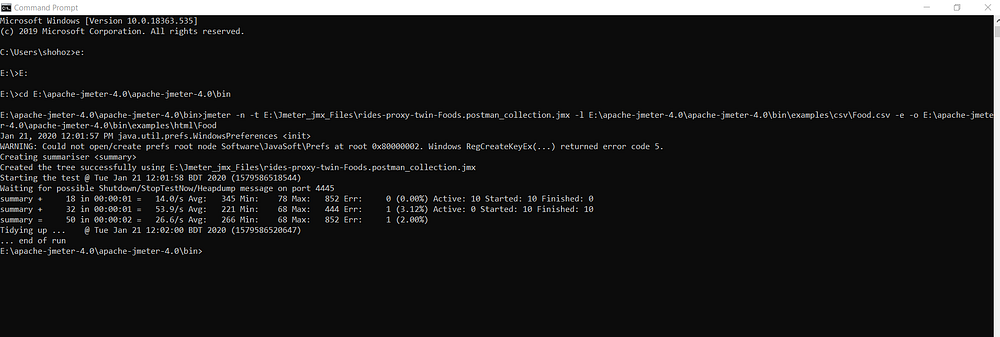
To run the command first you have to go to the drive in which you kept the Jmeter. Let’s say I kept my Jmeter in E drive.
Command: $ e:
Now go to the bin folder of your Jmeter.
Command: $ cd E:\apache-jmeter-4.0\apache-jmeter-4.0\bin
Now execute the full command.
Command: jmeter -n -t E:\Jmeter_jmx_Files\rides-proxy-twin-Foods.postman_collection.jmx -l E:\apache-jmeter-4.0\apache-jmeter-4.0\bin\examples\csv\Food.csv -e -o E:\apache-jmeter-4.0\apache-jmeter-4.0\bin\examples\html\Food

Now go to the csv folder and you will find the Food.csv file then go to the html>Food (output folder) and you will get there a index.html file which is your required html report.
To share the report, copy the .csv report to this folder and zip all these together and share. If you only share the index.html file it will not work, you have to share the whole folder.

Approach 2:
Suppose you have already created your test and also have your report in csv file, now want to create the html reports from csv file.
Command: jmeter -g E:\apache-jmeter-4.0\apache-jmeter-4.0\bin\examples\csv\Food.csv -o E:\apache-jmeter-4.0\apache-jmeter-4.0\bin\examples\html\Food
Step 5: Open the index.html file in your browser and you will find Dashboard and Charts. From dashboard you will get the APDEX, Result Summery, Statistics, Errors and Top 5 Errors by sampler.

From charts you will get different types of charts according to Over Time, Throughput and Response Times.

